Monitor the state of my instance and of my feeds
Via the LiveU Studio Monitoring (1) you can check the status of several things during the testing and publishing process:
Inputs status
Via the Inputs drop-down menu (2), select the live source you wish to monitor.

The graphs displayed give you detailed information on each of your input streams:
- Lost pictures : lost pictures since the feed started.
- FPS (10sec) : Frame per second (in the last 10 seconds).
- Fallback (percent) : if the feed is interrupted for more than 2 seconds the fallback/backup is enabled.
- demux discontinuity: an audio and/or video packet does not follow the previous one that we already know, it can be a clock reset or a breakage of the encoder, it does not necessarily mean that a packet is missing.
- demux corrupted: number of corrupted packets since the feed started.
- demux bitrate: the (undecoded) bitrate of the recevied input.
- Input bitrate: bitrate received by LiveU Studio for a specific stream.
Instance status
- The state/usage of memory and CPU from your encoder via the following graphs.
Please note that if the CPU or Ram usage exceeds 70% your instance may experience problems, in this case we invite you to reduce the number of inputs present in your Production studio and/or to modify the Publish settings (reduce the quality/modify the encoding profile, etc).

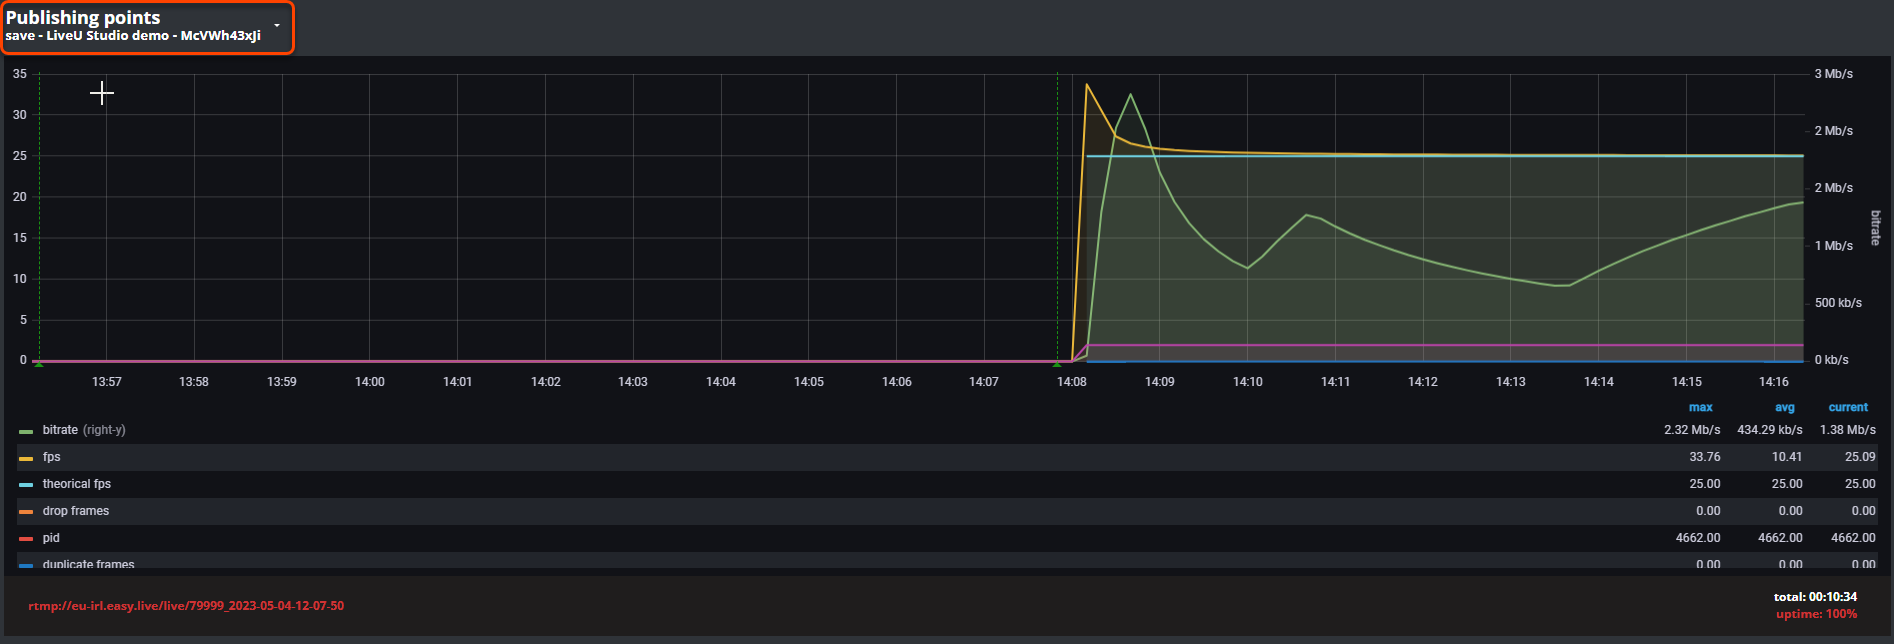
Encoder/Publishing points status
- The output bitrate/fps stats from LiveU Studio via the Encoder tab (example below).
- The activity time of this output point (total at the bottom right of the screen).

Congratulations! Now you know how to monitor your LiveU Studio event.
Next steps
Keep exploring
Can't find the right answer?
Contact the LiveU Studio Support team via our Live Chat.